In-Depth
Inside Look at the New Power BI Premium
Microsoft's Power BI Premium brings new data visualization and analytics capabilities, as well as feature changes across all license tiers.
When Microsoft last released a major upgrade to its Power BI two years ago, the self-service business analytics tool bundled with business editions of Office 365 no longer required Excel in order to use its full capabilities. It was an important shift in the then-fledgling tool in bringing business intelligence (BI) tools to those who aren't necessarily spreadsheet jockeys. Power BI and Microsoft suddenly rose from a distant follower into a market-leading BI cloud platform.
Indeed, even Microsoft officials acknowledge that the company's long-stated goal of upending the BI market wasn't taken seriously. "If we go back a couple of years, there were reasonable questions about Microsoft's commitment to the business intelligence market," said James Phillips, corporate VP of Microsoft's Business Applications, Platform and Intelligence (BAPI) organization, during a keynote address at the company's recent Data Insights Summit 2017, held in Seattle (a replay of this talk is available online).
Now, there aren't such questions. Microsoft is aiming to extend its new leadership in analytics with the recent launch of Power BI Premium. While it's not unusual for companies to release major upgrades to software, Power BI is now a cloud service, where updates are typically incremental. New capabilities are typically added weekly to the cloud service, while the development tool Power BI Desktop is updated monthly. So, with such an aggressive update cycle, what changes could Microsoft make to warrant the term "Premium" and label it as a major upgrade?
Accruing Cost Model
Despite its popularity, it's not perfect and there are many critics of Microsoft's decisions over Power BI features and licensing. Its cloud-only approach has turned off many people from adopting the platform. I recall discussing Power BI with someone at a major online retailer with an on-premises infrastructure who wasn't open to disaggregating the organization's BI and reporting system into the cloud. And while the cost to use Power BI at first may sound low, at $10 per user per month for the Pro version, at scale, the cost can accrue fast.
In most organizations, the number of basic data users far surpasses the number of content creators. Hypothetically, if your organization has 100,000 on staff, of which only 10,000 are content creators, it's difficult, if not impossible, to justify setting a monthly budget fee for data consumers. If only 30,000 of the staff need data access, that's a monthly cost of roughly $300,000, with an annualized cost of more than $3.5 million. A budget that size will cover a fairly sophisticated reporting infrastructure. So, could it be that Microsoft has made some moves to rectify these market position weaknesses? To find out, I took a look at Power BI Premium.
As I worked with it, I found that the Premium update could be broken down into three core categories: licensing, on-premises support, and general feature enhancements or changes.
New Licensing Plans
Initially, Microsoft offered three license categories for Power BI: Free, Pro and Embedded. The Premium update brings that to four options.
Power BI Pro is still the core product offering, but Microsoft is now looking to monetize cloud-based data sharing. From a licensing perspective, if you intend to share and distribute your Power BI dashboards and reports, all content creators require a Pro license.
One of the biggest weaknesses of Power BI Pro was that it was a one-size-fits-all license. Every user was considered both a content creator and a content user. What about the Free license? While a nice introduction to Power BI, it, too, offered limited functionality and restricted users' ability to share. It wasn't viable as a read-only license. Free users could not access or consume Pro-level features, even when created by someone with a Pro license. While simple, the Pro license model wasn't realistic. You might recall Lotus Notes also had a similar market approach—one tool for everyone, where content creators and content users all required the same license. Never heard of Lotus Notes? By the time Lotus realized that the market didn't fully embrace that approach, its market share was in decline.
Another shortcoming of Power BI was its shared-resource base. All users were part of the Power BI shared-resource base. It didn't let large organizations establish dedicated resources, nor did it provide the ability to increase the number of resources to high-tier BI reporting dashboards. The possibility existed that heavy usage across all Power BI users could slow everyone down. Limiting the excessive use of resource-intense features in a shared-resource base was another downside, posing restrictions on refresh rates for report data, for example.
Pro and Premium Plans
Customers wanted to go bigger, beyond the limits of the existing Power BI Pro license. They needed the ability to support the larger base of content users, and to go beyond the limits imposed by the shared-resource model. Microsoft's approach was to extend Power BI to enable organizations with the ability to have specifically identified dedicated resources in addition to the shared-resource base available to the licensed Pro users.
Effectively, the new Power BI Premium is an extension of the existing Pro license structure. All content creators still need a Power BI Pro license to create reports, dashboards and Power BI apps. Purchasing one or more Premium Capacity Nodes gives an organization the ability to open up its user-created Power BI apps to a wider audience, especially to those without a Power BI license looking to share their reports within their organization and externally.
Power BI Premium splits licensing between content creators and content users. Content creators still require a Power BI Pro license. Need to add a new content creator? Simply acquire a Power BI Pro license. And when an organization needs to scale up or scale out the number of apps supported under the Premium license, it can either upgrade the Capacity Node level, or add additional Capacity Nodes.
But what is a Power BI App, and just what does a Capacity Node represent?
Using Power BI Apps
With the introduction of Power BI Premium, and the ability to support both dedicated and shared dashboards and reports, the next question for Power BI administrators might be: "What do we map to our dedicated capacity? A report or a dashboard?" Some type of container was required, one that could hold reports, dashboards and the supporting data and links. Microsoft's approach was to evolve the existing Content Packs into what is called Power BI apps.
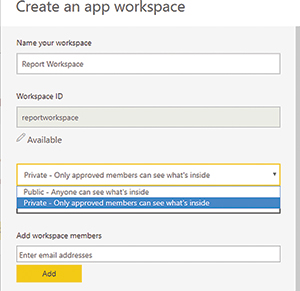
When Power BI was first released two years ago, your login opened to the default section called My Workspace. But as you added datasets, reports and dashboards, it could quickly become unmanageable. Microsoft has changed the whole model with the new Premium release. My Workspace still exists, but the workflow design focuses on apps and the app workspace. The first step in starting a new business project in Power BI is to create a new app workspace (see Figure 1).
 [Click on image for larger view.]
Figure 1. The Create an app workspace form gets the process started.
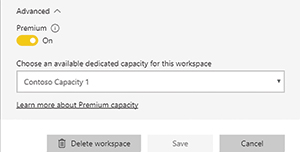
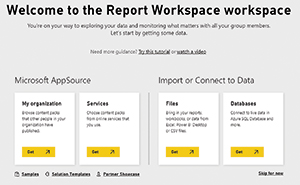
Next is to select the newly created workspace from the Workspaces menu. Once in the workspace, the overall process is the same. The BI solution is completed using datasets, workbooks, reports and dashboards. If the audience for the Power BI app includes non-Pro users, the Power BI administrator will assign the app to the appropriate Premium Capacity (see Figure 2). But the Power BI app doesn't have to be allocated to a Premium Capacity node. As a creator with a Power BI Pro license, you can still share it with anyone in your organization that holds a Pro license, using the existing shared Power BI resource framework. Yes, all users with a Pro license have access and utilization of the shared Power BI platform. Even if your organization has purchased Premium Capacity, new and existing dashboards, reports, and Power BI apps do not have to be allocated to your Premium Capacity. Administrators can also use the Report Workspace to assign access to different data types among different groups (see Figure 3).
 [Click on image for larger view.]
Figure 2. Interface to use Premium Capacity.
 [Click on image for larger view.]
Figure 3. The Report Workspace for assigning data among groups.
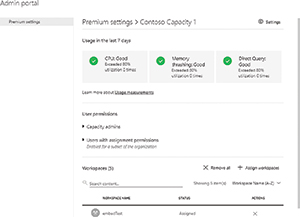
There's also an Admin portal, providing a view into CPU, memory and query utilization (see Figure 4).
 [Click on image for larger view.]
Figure 4. The Power BI Premium Admin portal.
Capacity Node
Power BI Premium currently supports three Capacity Node levels, and allows an organization to have multiple Capacity Nodes. You can also scale out, purchasing many named Capacity Nodes, and for any given Node, you can scale it up from the entry level P1 to P2 or P3. But, as a new service, it's not clear how many users can be supported with a single-entry level P1 node. In my use of the Power BI Premium calculator (access it here), the estimates displayed indicated that it supports just less than 2,000 users with a single-entry level P1 Capacity Node. A Microsoft white paper on Premium Capacity Nodes offers more details on this topic, which you can access here. Figure 5 shows a table from the white paper, depicting the different levels of Capacity Nodes.
 [Click on image for larger view.]
Figure 5. Table of Premium Capacity Nodes and cores needed to scale from Microsoft's Power BI Premium white paper.
The Free Edition
Microsoft still offers a Free version of Power BI, but now the focus is on a more powerful personal use of the BI tool. The features offered and the ability to share have changed. Gone is the ability to share with other Power BI users. To share you'll need the Pro version. One the plus side, the Free version is a more feature-complete tool kit.
Embedded Option
Applications typically have some built-in reports, often using SAP Crystal Reports as the embedded reporting tool. So, with Power BI Embedded, Microsoft gave application developers the ability to use the cloud-based Power BI as their embedded BI and reporting tool. As an embedded development tool, Power BI provided some excellent features. But as a cloud service, Microsoft needed a way to charge for the service with pricing initially charged on a per-use basis. While ideal for small operations with minimal monthly usage, high-use operations were concerned. The risk of unpredictable and potentially high monthly use charges limited adoption. Reading through the Power BI community postings, the need for a known, stable monthly charge for embedded reports was one of the top requests.
To provide a fixed monthly fee for Power BI Embedded, Microsoft pulled the Embedded platform under the Premium umbrella, along with a special Embedded-only pricing license model that starts at $625 per month. The downside is that from reviewing the Power BI community discussion board, there are numerous ISV/developers with embedded reports for small applications where the monthly use cost is far below the proposed $625 per month. Now abandoned, they either must start charging excessive costs to support the Power BI Embedded framework, or dump Power BI completely. Perhaps a simple solution for this dilemma would be to extend the pricing model for the Embedded product to continue to support a per-use cost rate. They already track usage. From a market position, keeping developers in the Power BI environment is a small price to continue to support per-usage charges.
On-Premises
As reported last year, I outlined how both the Power BI and the SQL Server Reporting Services (SSRS) teams were committed to unifying the two (see "SSRS Steps up in the Shadow of Power BI"). The objective was to enable and extend SSRS where all reports created using Power BI Desktop could be published on-premises using SSRS.
With the release of Power BI Premium, Microsoft has made an initial step in unifying SSRS with Power BI. Unfortunately, while it shows great promise, as a first step, it's limited in both ability and license accessibility. The questions are: What exactly is this new Reporting Services? Who can get this new extended service? What can it do or not do?
First, it's formally called Power BI Reporting Services (PBRS), so as not to be confused with the existing SSRS. And as of now, it's a completely separate component from SSRS. Functionally, it appears to be a branched version of SSRS that requires Power BI reports created using a branched version of Power BI Desktop specific to PBRS. Fortunately, for Power BI Desktop users, Patrick Baumgartner, Microsoft's principal program manager for Power BI, did indicate in the near future that the two branches of Power BI Desktop would be merged. What isn't known is if or when Microsoft will combine the two Reporting Services products.
If you just want to experiment with the new Reporting Services kit, simply download a trial version at the PBRS Web site. For production, PBRS isn't a stand-alone product. Much like how SSRS is licensed, if you buy "this," you get a PBRS license. Microsoft offers two paths to obtain a PBRS license:
- Acquire Power BI Premium capacity.
- Have a SQL Server Enterprise Edition license with software assurance.
Once you have PBRS up and running, what can you do and not do? I started looking into the extended Reporting Services last fall, when Microsoft made available in technical preview a pre-built virtual machine (VM) in Azure. While it was still called SQL Server Reporting Services, the overall functionality hasn't changed. As a branch of SSRS, PBRS supports all of the original features available in SSRS 2016. The primary difference is that is also supports reports created with the special version of Power BI Desktop.
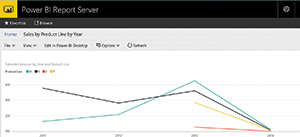
Starting with a pre-built virtual server running Windows Server 2012 and SQL Server 2016, I installed the trial version of PBRS along with the Reporting Services-specific Power BI Desktop. I was very quickly able to create a new report and upload it directly to the Power BI Report Server (see Figure 6). Overall, Power BI Report Server has a similar look and feel to the SSRS server, with the adjustment of changing the default display name to Power BI Report Server.
 [Click on image for larger view.]
Figure 6. Power BI Dashboard report in Power BI Reporting Services.
For now, PBRS only supports data connectivity from a SQL Server Analysis Services database, either tabular or multi-dimensional. The good news as it pertains to data connectivity is that Microsoft's Baumgartner has confirmed that support for the remaining Power BI data sources is planned by the end of this year. For now, PBRS doesn't represent an update for the existing SSRS. The two are considered separate services.
As an add-on supplemental product, Baumgartner indicated that it's not intended to be a full replacement for all the features in the cloud service. Power BI advanced features such as Q&A and Quick Insights will not be part of Reporting Services.
Q&A, Quick Insights and Natural Language Queries
While charts and graphs tend to get most of the attention in Power BI, Microsoft has been continually working to improve the behind-the-scenes work on natural-language queries. The latest release promises to provide advancements in ways to query data. If you've been an analyst, or worked closely with one, you know that every dataset or report you give them pushes them to ask more questions. Both Q&A and Quick Insights have been part of Power BI for a while, but in this testing, they've continually improved.
What's Next for Power BI
I hoped for insights into the next features for Power BI, and when they might be released. Unfortunately, I didn't get any at press time, but Baumgartner did confirm that the Power BI leadership team closely monitors the Power BI Ideas topic area, where users can propose and vote on what areas they'd like to see next incorporated into Power BI. So, want or need a new feature or an existing one enhanced? Queue it up on the Ideas forum, and work your network to start voting.